Easily track and build SMRP and custom KPI reports and integrate with business intelligence software.
Automated SMRP & Custom KPI Reporting
Building KPI reports with a CMMS can be complex, time-consuming and frustrating. Excel scheduling leads to lost data, inaccuracies and ‘best guesses’ compromising KPI reporting.
Sockeye’s SMRP and custom KPIs are based on verifiable data. Easily check the latest in Sockeye’s SMRP KPI dashboard, automatically build KPI reports and customize to your needs.
“We have a company-wide focus on reliability. Right now, that is our key metric. What’s generated out of Sockeye is the bible.”
Planning & Scheduling Superintendent
Reporting
Automated SMRP KPI Reporting
KPI Reports are automatically built and easily shareable.
Headline
Condition-based Maintenance Hours
Actual hours worked on condition-based work orders. Condition-based Hrs ÷ Total Hrs x 100
Headline
Continuous Improvement Hours
Actual hours on continuous improvement work orders. Continuous Improvement Hrs ÷ Total Hrs x 100
Headline
Corrective Maintenance Hours
Actual hours worked on corrective work orders. Corrective Hrs ÷ Total Hrs x 100
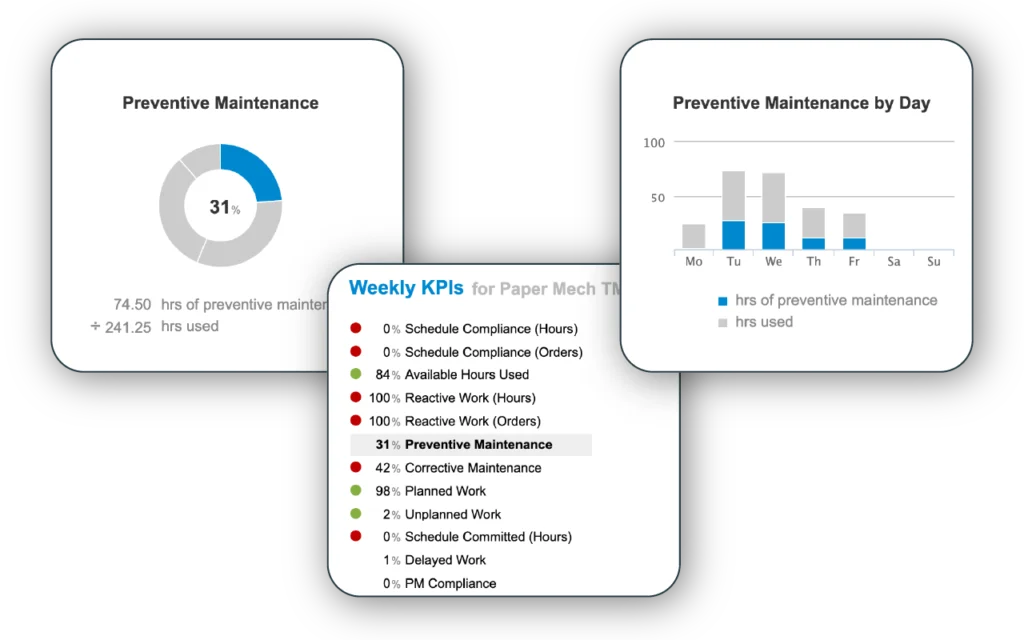
Dashboard
SMRP KPI Dashboard
Easily access the latest with Sockeye’s SMRP KPI dashboard and customize it according to your specifications.
Headline
Planned Work
Actual hours on planned work orders. Planned Hrs ÷ Total Hrs x 100
Headline
Preventive Maintenance Hours
Actual hours worked on preventive work orders. Preventive Hrs ÷ Total Hrs x 100
Headline
Proactive Work
Preventive and predictive hours plus corrective hours identified from preventive and predictive work orders. Proactive Hrs ÷ Total Hrs x 100
Schedule automatic report sharing to specific individuals or teams.
Delay Tracking
Track why work was delayed, identify trends and eliminate waste using Sockeye’s drop-down menu displaying frequent reasons for delayed work (parts missing, asset unavailable, weather, etc.).
Split Screen Graphs
Check weekly KPIs while viewing the weekly schedule with a live KPI dashboard displaying a variety of graphs.
Easy Schedule Compliance
When you finish building a weekly schedule for an upcoming week, simply select “Commit Weekly Schedule”. This saves a snapshot of the currently scheduled tasks and hours for that week.
Crew Utilization Tracking
Sockeye automatically tracks and displays a live graph showing the percentage of available labor scheduled.
Supported by Maintenance Professionals
Sockeye is ready to support your KPI goals with former Maintenance Schedulers who understand the realities you face.
Get Started
Take the next step to a data driven maintenance team.