
If you’re a maintenance planner or scheduler, you already know the drill. The CMMS has the work order backlog. A spreadsheet has this week’s schedule. Maybe a second spreadsheet tracks crew availability. Nobody trusts any of them fully, so someone spends Thursday afternoon reconciling all three before Friday’s schedule meeting.
That reconciliation work isn’t just annoying. It’s a direct drain on wrench time, the share of a technician’s available time spent productively on the job rather than walking, waiting, or hunting for information. And wrench time is the number that determines whether your maintenance organization is efficient or just busy.
The hidden cost of the spreadsheet workaround
Here’s what actually happens when the weekly schedule lives outside the CMMS.
A planner builds the schedule in Excel because it’s flexible and fast. The CMMS, whether it’s SAP PM, Maximo, or JD Edwards, still holds the official work order backlog, but the two systems don’t talk to each other. So every change gets entered twice: once in the spreadsheet to keep the schedule current, once in the CMMS to keep the record straight. Skip one and you get schedule drift. Skip it long enough and nobody trusts the CMMS data at all.
Meanwhile, crew capacity lives in someone’s head or a third spreadsheet. When a planner builds next week’s schedule, they’re not checking capacity against a live view of the backlog. They’re guessing, based on what they remember from last week’s crew meeting. That guess is usually wrong in one direction: overloading the schedule past what the crew can actually execute.
Every one of these gaps, duplicate entry, stale backlog data, disconnected capacity numbers, shows up downstream as low schedule compliance. Techs get pulled off scheduled jobs for breakdowns that a better backlog view might have caught. Planners spend hours chasing status instead of planning the next job. And wrench time, the actual measure of value delivered, erodes quietly.
Wrench time is measured, not guessed
This isn’t a theory. Wrench time, sometimes called hands-on tool time, has been measured on plant floors for decades using work sampling studies. The gap between typical wrench time and what disciplined planning and scheduling organizations achieve is well documented in plant maintenance research.
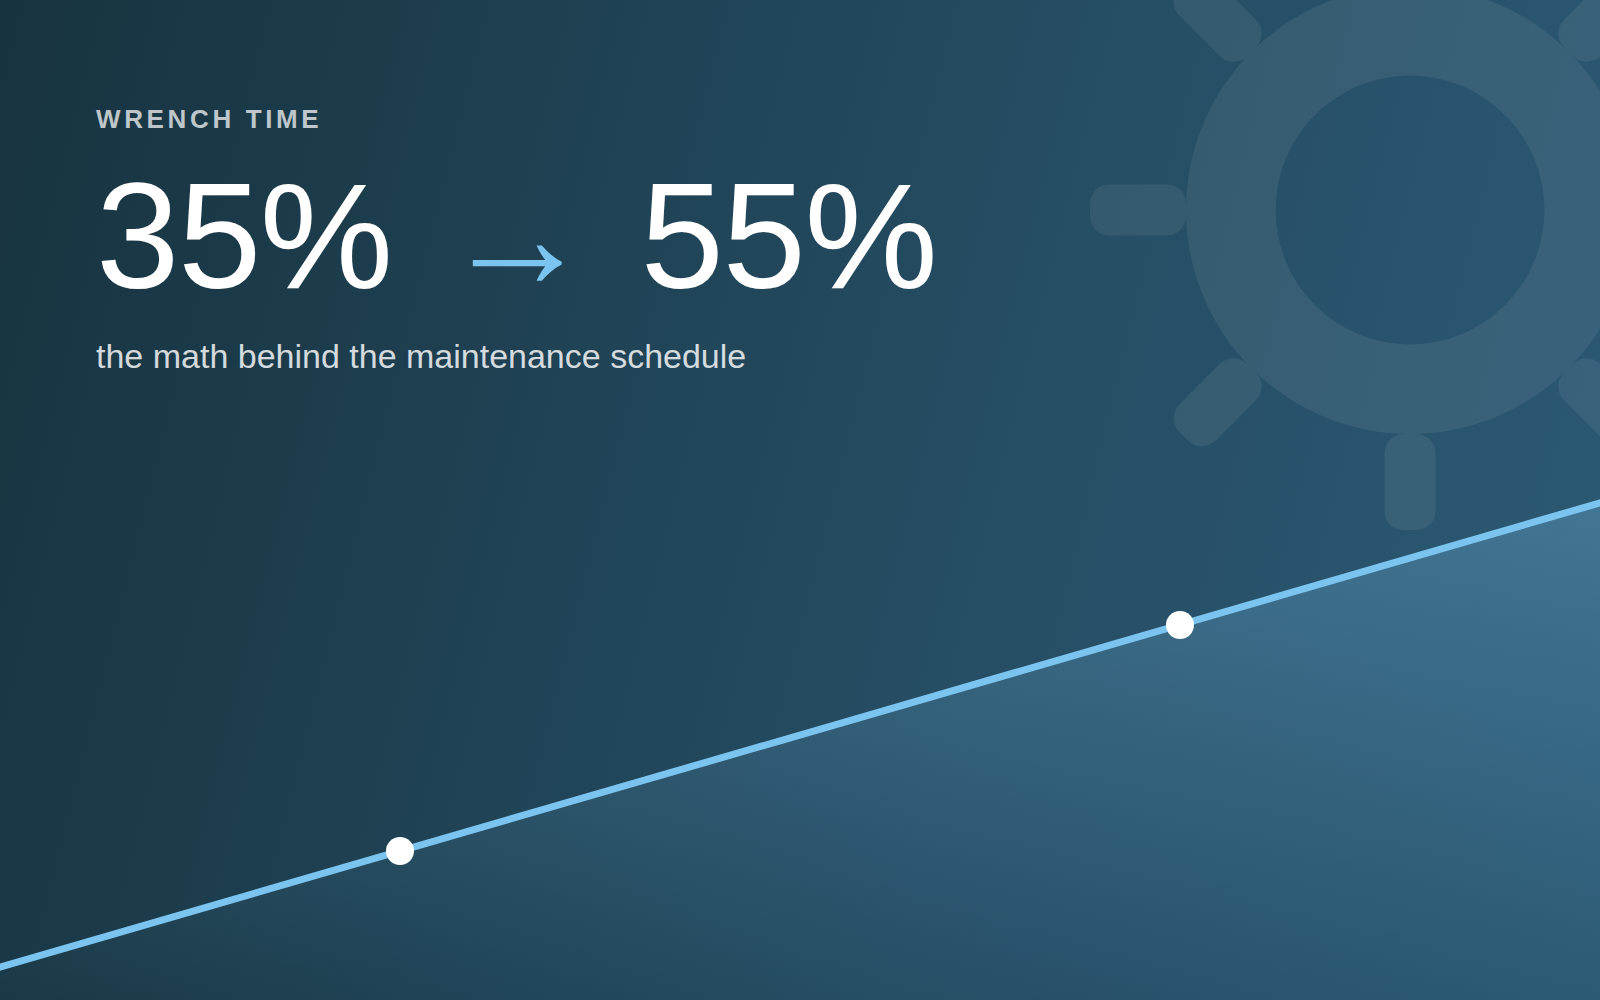
“Even so, statistical work sampling studies reveal that “wrench time” for most maintenance forces is only about 35%.”
“Proper planning and scheduling can boost the wrench time to upwards of 55%.”
“At 55%, 30 people were as productive as 47 team members operating at a 35% wrench time.”
“That’s because a planner can help boost the productivity of a 30-person workforce to where it completes work orders as if it had 47 persons.”
Most published figures come from general plant maintenance rather than any one industry, so treat them as a starting point and sample your own crew for your site’s number. Sites with strong planning and scheduling discipline, meaning a clean backlog, an accurate weekly schedule, and known crew capacity, tend to land closer to the higher end of that range. In our experience, sites running the schedule out of spreadsheets disconnected from the CMMS tend to land closer to the lower end.
Run your own numbers
Benchmarks are useful, but your plant has its own crew size, its own loaded labor rate, and its own current wrench time. The real question is what closing even part of that gap is worth to you specifically.
Enter your numbers below and see the math for yourself. The formulas are shown right next to the results, so you can check every step.
Run your own numbers
Drag the sliders. Every figure below is arithmetic on your inputs; the formulas are one click away.
How it’s calculated
extra hours/yr = crew × paid hours × (target − current) × 52
annual value = extra hours × loaded rate
The chart below plots the same relationship: as wrench time improves, the equivalent crew size effectively grows, even though headcount hasn't changed. Your current point and a disciplined-planning benchmark point are both marked, so you can see the size of the gap in crew terms, not just percentages.
That "equivalent crew size" number is the one worth bringing to your maintenance manager or COO. It reframes wrench time from an abstract efficiency metric into a staffing conversation. If closing the gap is worth two or three extra techs' worth of hands-on time a year, that's a number finance understands.
Why disconnected spreadsheets shrink wrench time
It's worth being specific about the mechanism, because it points directly at the fix.
Duplicate data entry eats planner time that should go to planning. Every hour a planner spends copying job status between a spreadsheet and the CMMS is an hour not spent building a clean, kitted, ready-to-execute weekly schedule. Bad planning upstream means more delay downstream, which shows up as lost wrench time on the floor.
Stale backlog visibility leads to bad prioritization. If the spreadsheet schedule isn't pulling live from the CMMS work order backlog, planners are scheduling against a snapshot that's already out of date by the time the crew starts the week. Jobs that should have been prioritized get missed. Jobs that got closed out elsewhere stay on the schedule.
No shared view of crew capacity means overloaded or underloaded schedules. Without a real-time picture of who's available, on PM rounds, or already committed, planners either overschedule, which crushes compliance, or underschedule, which leaves capacity sitting idle. Either way, the gap between scheduled hours and actual hands-on hours grows.
Overscheduling doesn't just crush compliance, it also buys unnecessary overtime. When the week is reactive and prioritization is off, the jobs that truly have to happen get squeezed into whatever hours are left, and those are often premium hours. Add the way most schedules get built, a planner relying on their own eye to Tetris a spreadsheet into minimum OT and maximum scheduled work orders, and you have a genuinely hard optimization problem being solved by hand, every week. Some weeks it works out. The other weeks, the plant pays the difference in time-and-a-half.
Multiple disconnected tools mean multiple versions of the truth. When the planner's spreadsheet, the scheduler's spreadsheet, and the CMMS all disagree, coordination between planners, schedulers, and crews slows down. Every discrepancy needs a conversation to resolve. Those conversations are necessary, but they're not wrench time.
None of this is a discipline problem. Planners and schedulers using spreadsheets are usually working hard and working smart with the tools they have. The problem is structural: the tools don't connect to each other or to the CMMS that's supposed to be the system of record.
What to do about it this week
You don't need new software to start closing part of this gap. Start here:
- Pick one week and track the source of every schedule change. Did it come from the CMMS backlog, a supervisor conversation, or a spreadsheet edit that never made it back into the CMMS? This tells you where your data is actually leaking.
- Compare your weekly schedule hours to actual crew capacity hours, on paper, for one week. Most planners have never done this side by side. It usually reveals whether you're systematically over- or under-scheduling.
- Time how long it takes to answer "what's our current backlog by priority and craft" right now. If it takes more than a couple of minutes and more than one system, that's your integration gap in concrete terms.
- Calculate your own wrench time cost using the numbers above, and bring the equivalent crew size number to your next planning meeting, not as a pitch, but as a diagnostic.
- Audit how many places crew availability lives. If it's more than one spreadsheet plus tribal knowledge, that's the first thing to consolidate, even before touching software.
These steps won't fix the underlying disconnection between your CMMS and your scheduling process. But they will tell you exactly how big the problem is at your site, in hours and dollars, not guesswork.
Where a connected scheduling layer fits
The reason spreadsheet schedules drift from the CMMS backlog is structural: spreadsheets don't read live data from SAP PM, Maximo, or JD Edwards, and they don't hand data back either. A scheduling layer that sits alongside your existing CMMS and pulls the backlog and crew capacity into one weekly and daily view removes the duplicate entry and the guesswork described above, without asking you to replace the CMMS you already run.
Sockeye Technologies builds exactly that: a planning and scheduling layer that works with your existing SAP PM, Maximo, JD Edwards, or Infor EAM system, so your weekly schedule reflects the real backlog and real crew capacity, not a spreadsheet snapshot from Wednesday. Whether or not that's the right fit for your site, the math above holds either way. Run it, and see what your own gap is actually costing you.
