AUTOMATED SMRP KPI REPORTING
Track the effectiveness of your team and your schedule
Get automated, pre-built reports on scheduling metrics based on SMRP standards. Easily build custom KPI dashboards. Send all data to your business intelligence software.
KPI DASHBOARD
Scheduling data you can trust
Building KPI reports with a CMMS can be complex, time-consuming and frustrating. Excel scheduling leads to lost data, inaccuracies and best guesses that compromise reporting. Sockeye’s scheduling KPIs are based on verifiable data — sitting in a visual, configurable, and easy to understand dashboard.
“We have a company-wide focus on reliability. Right now, that is our key metric. What’s generated out of Sockeye is the bible.”
Todd Hicks, Planning and Shutdown Superintendent AT AV GROUP
SHARABLE REPORTS
Reporting made simple
Everything you need to confirm data accuracy, generate reports, and share it with the right people (or software).

Automated, easy-to-share report
Schedule automatic report sharing to specific individuals or teams. Can be done for both out-of-the-box KPIs and custom built reports.

Split-screen graphs
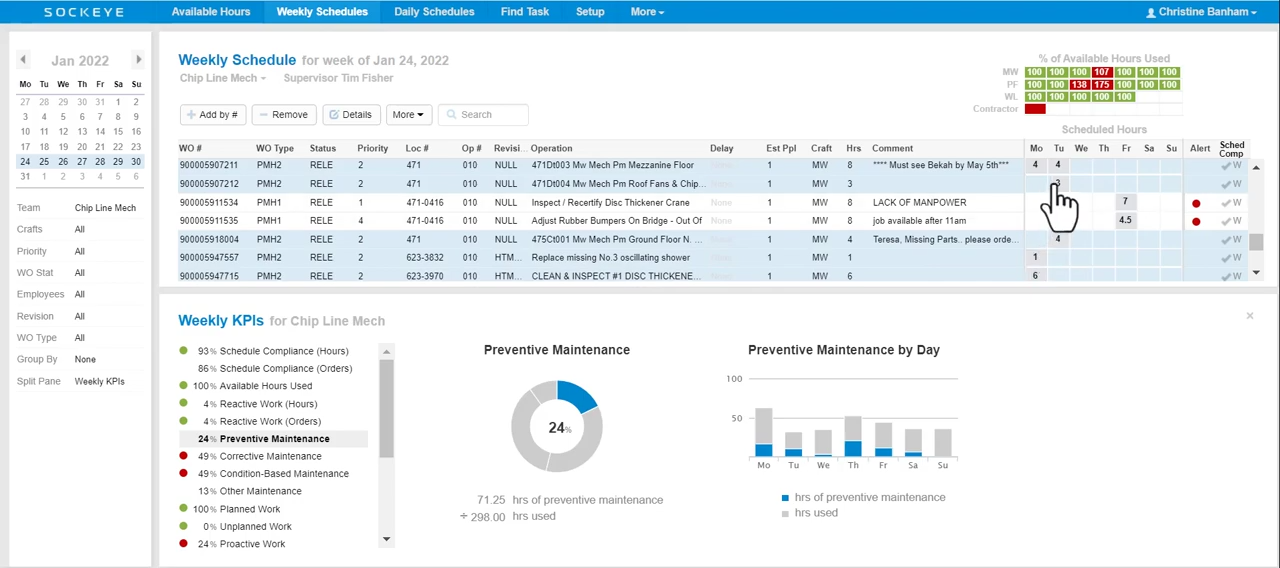
Monitor weekly KPIs while viewing the weekly schedule with a live KPI dashboard displaying chosen graphs.

SMRP KPI dashboard
Review all scheduling data inside a single, customizable dashboard. Click on any metric to see and verify the data used for its calculation.

BI software integration
Sockeye integrates with all popular Business Intelligence software. Visualize your KPIs, identify waste, and turn labor and scheduling data into progress.
Test Sockeye for 30 days.
No IT involvement required.
Confirm user adoption and get a proof of concept before spending a single cent.
TAKE THE FREE TRIALBUILT-IN SMRP METRICS
Key scheduling metrics at your fingertips
Sockeye comes pre-set with a dashboard of KPIs replicating the Society of Maintenance Reliability Professionals (SMRP) guidelines. You can see the list of those metrics below. Administrators can add additional KPIs and adjust KPI target ranges to fit their organization’s standards.
| Metric/KPI | What it does | Value for scheduling teams |
|---|---|---|
| Schedule Compliance — Hours | Measures scheduled work actually performed as a percentage of total time available to schedule. | Shows whether the weekly schedule is realistic and being followed. Low performance may indicate too much break-in work, poor estimates, or weak schedule discipline. |
| Schedule Compliance — Orders | Measures the number of scheduled work orders completed as scheduled versus total scheduled work orders. | Helps teams see whether jobs are being completed as planned, not just whether hours were consumed. Useful for assessing schedule execution at the work-order level. |
| Available Hours Used | Measures the percentage of available maintenance hours that were scheduled during the week. | Helps planners and schedulers understand labor utilization. Too low may mean under-scheduling; too high may leave no room for emergencies or priority changes. |
| Reactive Work — Hours | Measures work that breaks into the weekly schedule as a percentage of total maintenance labor hours. | Shows how much unplanned or interruptive work is disrupting the schedule. |
| Preventive Maintenance — Hours | Tracks maintenance labor hours used on fixed-interval preventive maintenance tasks. | Helps teams understand how much labor is being invested in routine failure-prevention activities. Useful for balancing PM workload against corrective and reactive work. |
| Corrective Maintenance — Hours | Measures labor used to restore equipment during or after failure. | Shows the burden of repair work. Trending this helps evaluate whether preventive and predictive programs are reducing asset failures. |
| Condition-Based Maintenance — Hours | Tracks hours spent on performing condition-based maintenance work. | Helps track how much work is spent on proactive maintenance. |
| Other Maintenance — Hours | Captures hours not included in preventive, corrective, emergency work, and other predefined KPIs | Useful for spotting miscellaneous work categories that consume capacity but may not be clearly managed. |
| Planned Work — Hours | Measures completed planned maintenance work as a percentage of total maintenance labor hours. | Higher planned work usually means better readiness, fewer delays, better parts coordination, and more efficient craft execution — and vice versa. |
| Unplanned Work — Hours | Measures completed unplanned maintenance work versus total maintenance labor hours. | High unplanned work can signal poor backlog quality, weak prioritization, or excessive emergency demand. |
| Proactive Work — Hours | Measures how much work is done on proactive maintenance. | Useful for reliability programs trying to reduce reactive maintenance. |
| Standing Work Orders — Hours | Measures hours charged to standing or blanket work orders, such as recurring short-duration work, housekeeping, meetings, or training. | Helps control labor that is not tied to specific assets or formal work orders. High usage may hide true asset costs or reduce work-history quality. |
| Continuous-Improvement — Hours | Measures maintenance labor hours used on continuous-improvement activities. | Shows how much labor is being invested in improving reliability, planning, safety, productivity, and similar. |
| Emergency Work — Hours | Measures maintenance employee labor hours used on emergency or break-in work. | Useful for identifying reliability problems and schedule-risk drivers. |
| Schedule Committed — Hours | Measures hours committed to the weekly schedule versus total available hours. Sockeye snapshots the approved weekly schedule when it is committed. | Helps teams confirm whether they are committing an appropriate amount of available labor before the week begins. It supports schedule-load balancing and schedule meeting discipline. |
SOCKEYE’s KPI TRACKING LOGIC
Make better scheduling decisions
Most maintenance scheduling KPIs are simple and easy to calculate. The real value in a tool like Sockeye is that it ensures the data is accurate, that the reports are generated automatically, and that the output is an easy to understand graph you can act on quickly.
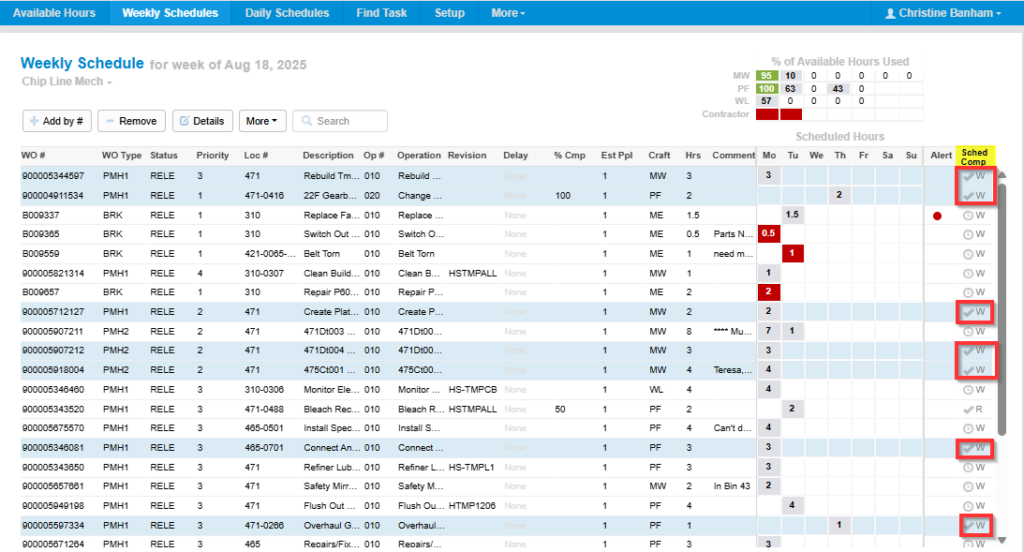
Schedule compliance orders example
This metric shows how many work orders are completed by their due date and is expressed as a percent of total number of scheduled work orders.
Work orders that were executed on time are marked with “✓” in the last column on the right (see marked fields on the screenshot).
Formula used for the calculation:
Scheduled Compliance (%) = (Number of Weekly Schedule Work Orders performed / Total Number of Weekly Schedule Work Orders) x 100
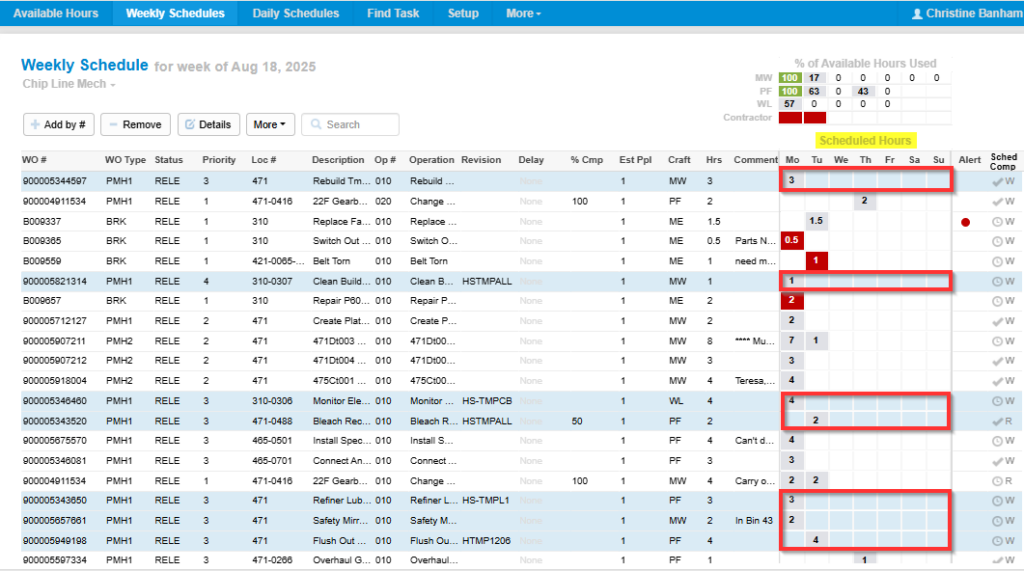
Corrective maintenance hours example
This metric shows how much labor hours your teams spent on fixing broken equipment and is expressed as a percent of total labor hours spent an all maintenance activities.
The numbers going into the calculation can be seen under the “Scheduled hours” column inside Sockeye. Naturally, only corrective WOs are taken into account.
Formula used for the calculation:
Corrective maintenance Hours (%) = (Corrective Maintenance Hours / Total Maintenance Labor Hours) x 100
cmms/EXCEL KPIs vs Sockeye KPIs
Do you trust the data in your CMMS? If you’re using spreadsheets, you shouldn’t.
If your team is using Excel to schedule and track work, the data in your CMMS is worthless. You can’t trust those reports. By simplifying the process and making sure all work is scheduled through Sockeye, you get a single source of truth for all scheduling data.
“There was no way to trust the accuracy of metrics because no matter what you do with a spreadsheet, once somebody copies it to their desktop, they can change whatever they want.
Sockeye eliminated the ambiguity associated with previous spreadsheets and paper-based processes. Now a work order is either done or not. We’ve captured the consistency we sought by implementing Sockeye.”
Todd Hicks, Planning and Shutdown Superintendent AT AV GROUP
DATA-DRIVEN RELIABILITY
Other things you can track with Sockeye
Sockeye comes with a bunch of small features that boost scheduler’s productivity and improve the effectiveness of your weekly schedules.

Headline
Work order delay reasons
Track why work was delayed, identify trends and eliminate waste using Sockeye’s drop-down menu displaying frequent reasons for delayed work (parts missing, asset unavailable, weather, etc.).

Headline
Real-time crew utilization
Sockeye automatically tracks and displays a live graph showing the percentage of available labor scheduled.

Headline
Overtime warnings
Sockeye gives you a visual indicator if an individual or contractor is overbooked on a specific day to simplify rescheduling and reduce avoidable overtime.
Supported by experienced schedulers
Sockeye is developed in collaboration with former Maintenance Schedulers who understand the realities you face and will help you reach your KPI goals.
Book a Demo